Cyclotron: NASA's Astronomy Picture of the Day
Today I'm going to walk through how to automatically pull NASA's Astronomy Picture of the Day and display it on a Cyclotron dashboard.
NASA has the API documentation available here. It's pretty straightforward without a lot of parameters, and can be used with a demo API key. Here's a sample URL that pulls up an HD version of today's Picture of the Day:
https://api.nasa.gov/planetary/apod?api_key=DEMO_KEY&hd=true
Cyclotron has a JSON Data Source which can load this, and the HTML Widget can be used to display the picture. There's also an Image Widget—but it can't be used as it doesn't support Data Sources.
Setup
To get started, you'll need Cyclotron to be installed and running. There's a Getting Started guide that walks through the installation process.
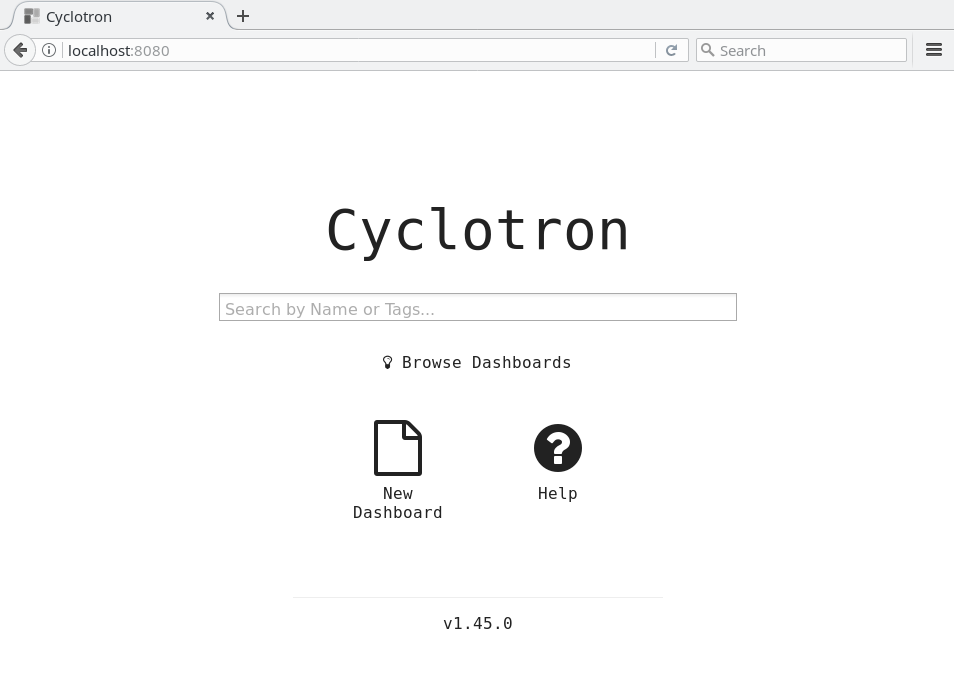
Once Cyclotron is up and running, it should look something like this:
Creating a Dashboard
Click on the New Dashboard icon to start a new dashboard. This opens the Dashboard Editor, and you can start filling out the fields. I called my dashboard "nasa-picture-of-the-day". The Name must be lowercase and snake-case, and it will automatically correct it if needed. I also added a few Tags and a Description, although those are optional.
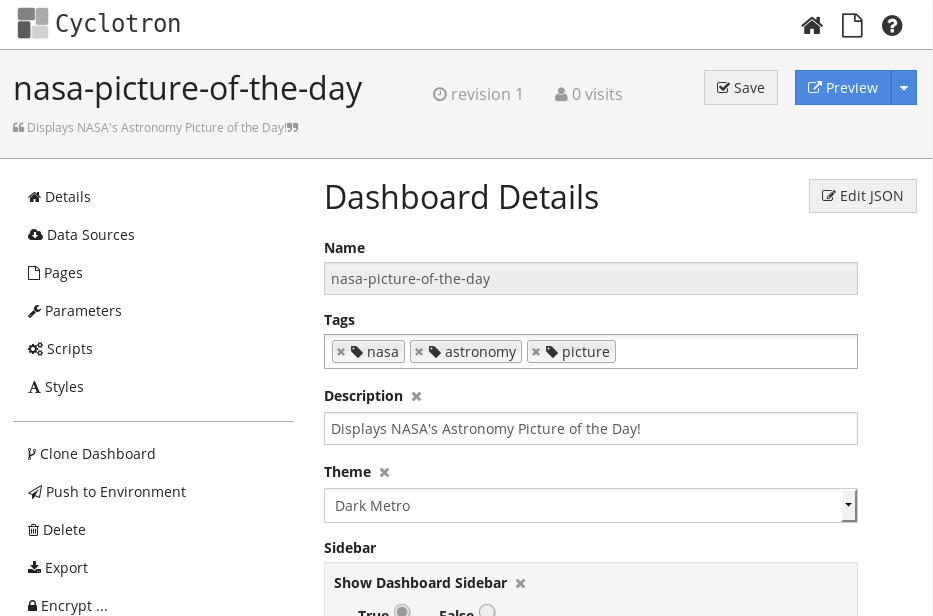
The Dashboard can be saved anytime, so you can either save incremental changes or everything once at the end. I prefer to save frequently in case I want to rollback, but also so I can preview my changes.
Adding a Data Source
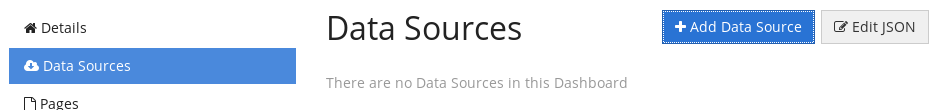
Switch to the Data Sources section and click on Add Data Source:
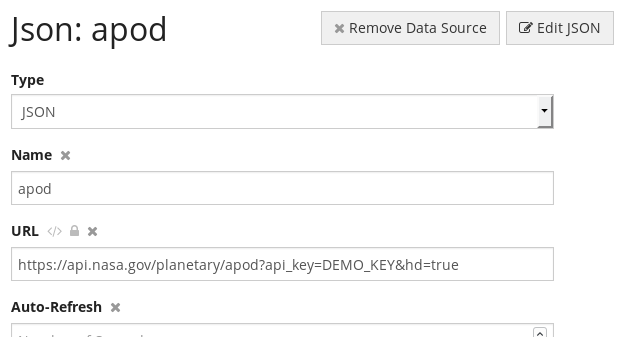
Select the new Data Source, and change its type to JSON.
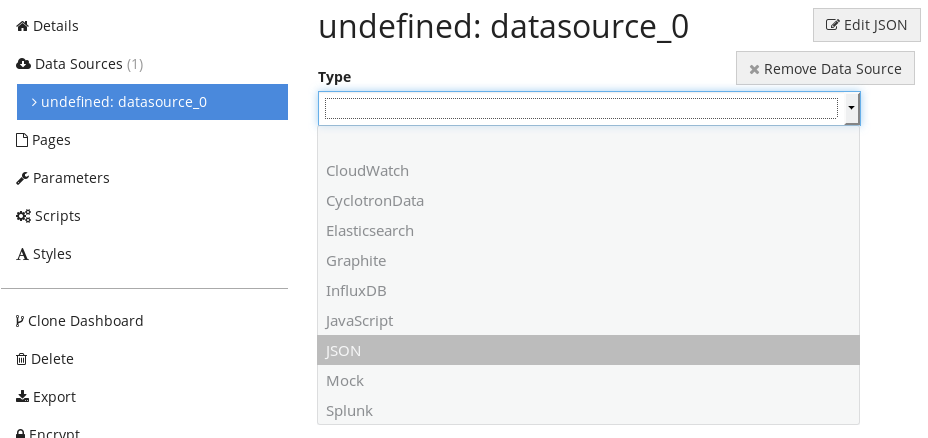
Switching to JSON type loads a specific set of properties for working with web services. Give the Data Source a name—I used the name of the API, "apod". Next, paste in the NASA API URL from above.
Cyclotron knows how to run this Data Source, load the API URL, and fetch the JSON response.
There is one remaining step, and that is to transform the response JSON into Cyclotron's standard data format. The NASA API returns a single JSON object, but Cyclotron typically expects an array of objects, which easily maps to rows and columns of a table.
Fortunately, this transformation can be done easily inside Cyclotron using JavaScript. Data Sources have a Post-Processor property, which is an optional JavaScript function. If specified, it runs the function every time the Data Source completes, passing in the original response. This allows the Post-Processor to inspect, modify, or even replace the response.
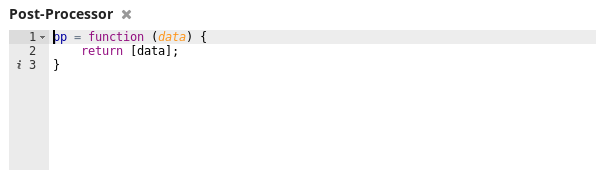
In this case, we need a very simple Post-Processor: all it needs to do is return an array containing the original object:
Here's the text:
pp = function (data) {
    return [data];
}
The function wraps the original JSON object inside an array and returns the array, replacing the original. Any Widgets that use this Data Source will get the modified array, rather than the original object.
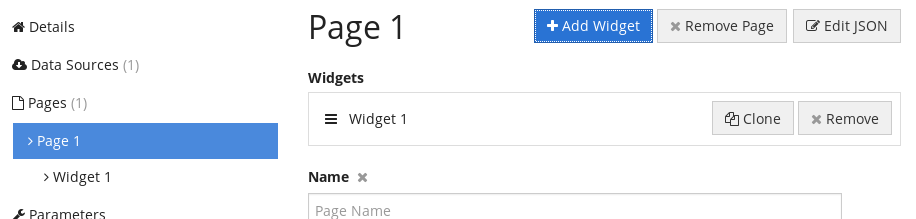
Adding a New Page
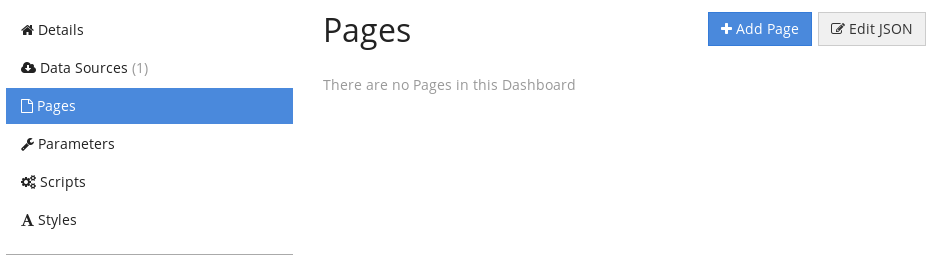
Switch to the Pages section and click on Add Page:
That creates a new "Page 1". Open the details of that Page so we can add Widgets to it. But first, we should update the Layout of the Page. The default is a 2x2 grid, but we want to change that to 1x1 to display a single HTML Widget. Change the Grid Columns and Grid Rows properties both to 1.
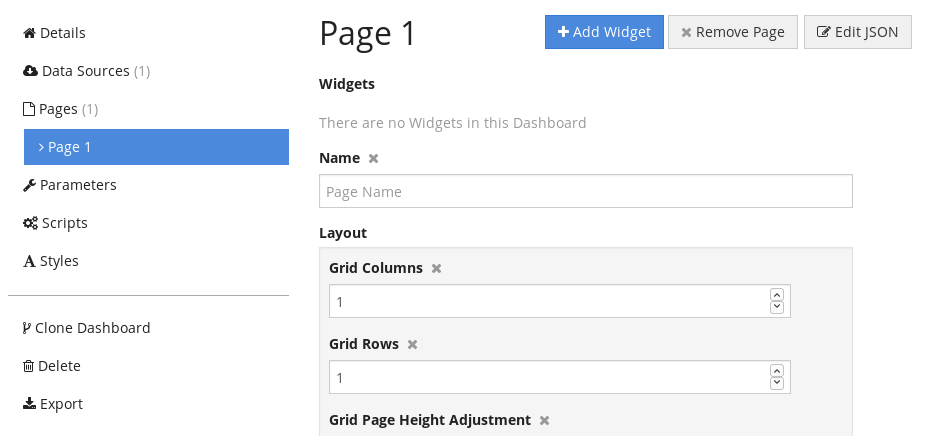
Next, we want to add an HTML Widget to the Page. Click the Add Widget button at the top of the page, which creates a new, blank Widget.
Adding an HTML Widget
Switch to viewing the Widget 1 properties. Initially, no properties are visible except the Widget Type. Selecting HTML from the dropdown will load a set of type-specific properties.
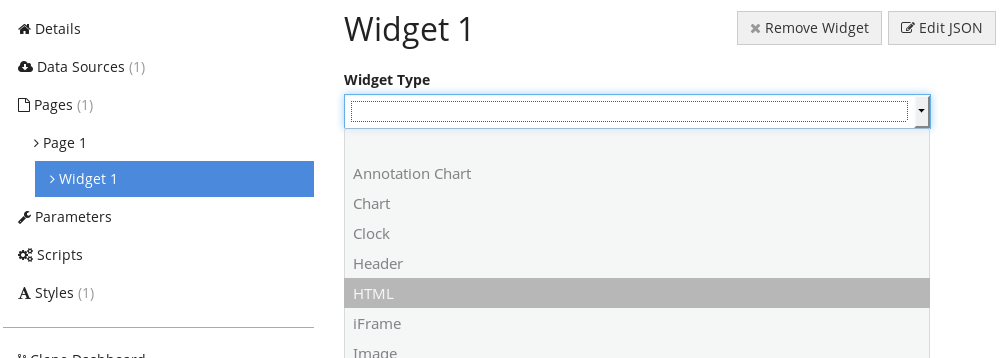
The HTML Widget has two specific properties that we need to provide: the Data Source, so it can load data from the NASA API, and the HTML content, so it knows how to display the data.
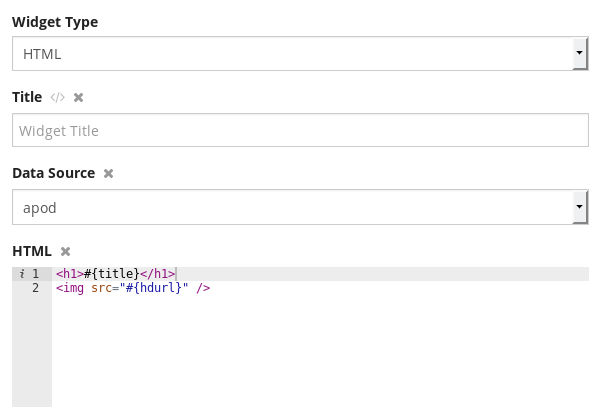
Data Source is a dropdown of all the previously-defined Data Sources—we only have one, so select it. That leaves the HTML property.
Here's the HTML content I'm using:
<h1>#{title}</h1>
<img src="#{hdurl}" />
The template notation used in Cyclotron is #{columnName}, where columnName is a column in the Data Source. In this case, it's using the .title and hdurl columns from the APOD API.
When used without a Data Source, the HTML Widget just displays the contents of the HTML property as-is. But if a Data Source is selected, it becomes a repeater—that is, it renders the contents of the HTML property for each row in the Data Source. In this case, there's only one row in the Data Source, so it will output exactly one <h1> and one <img />.
Preview
Now that we have the Data Source and Widget hooked up, it's a good time to preview what it looks like. You could have previewed the dashboard at any point, but there was nothing to see until now. Click the Save button then the Preview button to open the dashboard in a new tab.
Here's my dashboard:
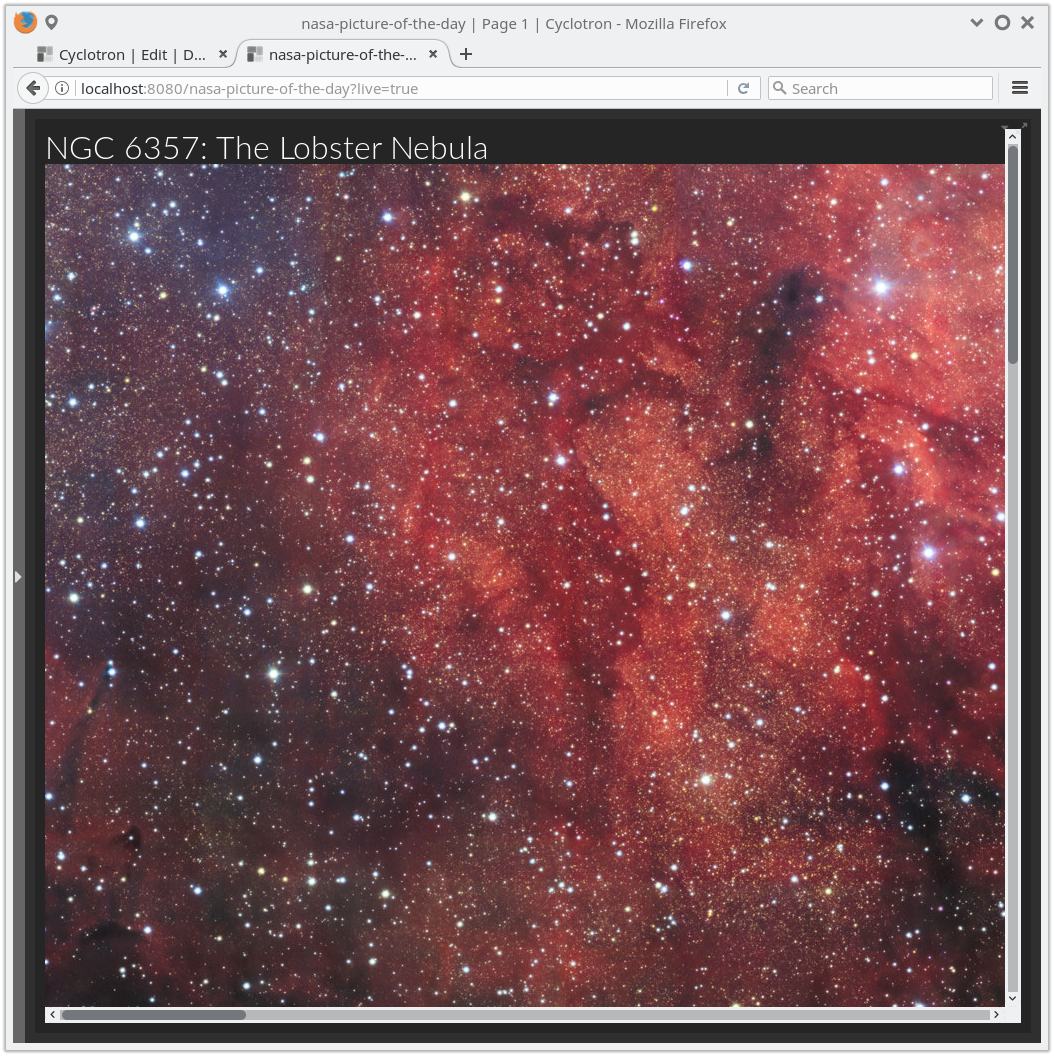
Additional Styling
The HD picture of the day is a bit larger than my screen, so we can improve the dashboard by adding some CSS styling. This could be added in the HTML Widget using a <style> tag, but Cyclotron also has a separate built-in section for any CSS rules or overrides.
img {
    width: 100%;
}
This is a pretty broadly-applied CSS rule, but works since our dashboard has no other images! It will scale larger images down, and smaller images up.
Now the dashboard looks like this:
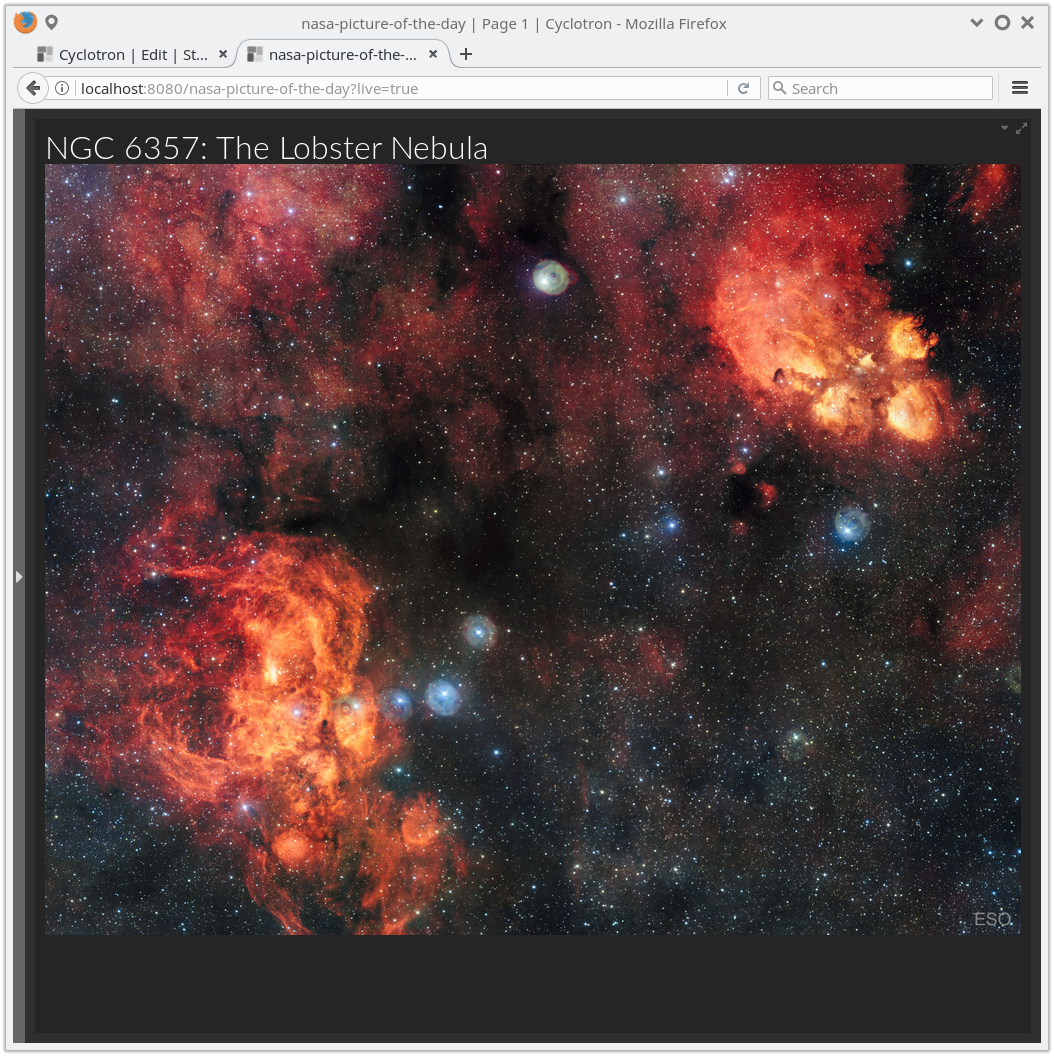
Final Dashboard
That wraps up this dashboard. It's linked to the NASA Astronomy Picture of the Day, so every day it will display something different. Here's the final, complete JSON of my dashboard:
{
    "dataSources": [{
        "name": "apod",
        "postProcessor": "pp = function (data) {\n    return [data];\n}",
        "type": "json",
        "url": "https://api.nasa.gov/planetary/apod?api_key=DEMO_KEY&hd=true"
    }],
    "description": "Displays NASA's Astronomy Picture of the Day!",
    "name": "nasa-picture-of-the-day",
    "pages": [{
        "frequency": 1,
        "layout": {
            "gridColumns": 1,
            "gridRows": 1
        },
        "widgets": [{
            "dataSource": "apod",
            "html": "<h1>#{title}</h1>\n<img src=\"#{hdurl}\" />",
            "widget": "html"
        }]
    }],
    "sidebar": {
        "showDashboardSidebar": true
    },
    "styles": [{
        "text": "img {\n    width: 100%;\n}"
    }],
    "theme": "darkmetro"
}
You can copy this straight into Cyclotron by creating a new dashboard, then selecting Edit JSON and pasting this into the JSON Editor.
Suggestions for future improvements:
- Ability to view previous days' images
- Support for
media_type: "video", - Improved image display, maybe using
object-fit: cover
Happy dashboarding!